Quick Overview
This Tips & Trick shows how to use an NX formula field and face’s isolines to easily define a spatially-varying pressure load.
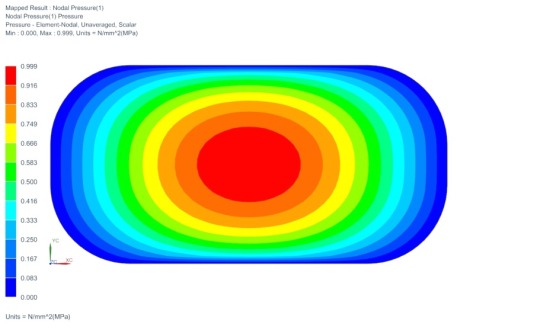
Figure 1. Spatially-varying pressure load
Core content
Let’s assume that it is intended to define a pressure distribution over the face shown in Figure 2, such that the maximum pressure occurs at the center of the geometry and gradually decreases to zero at the edges.
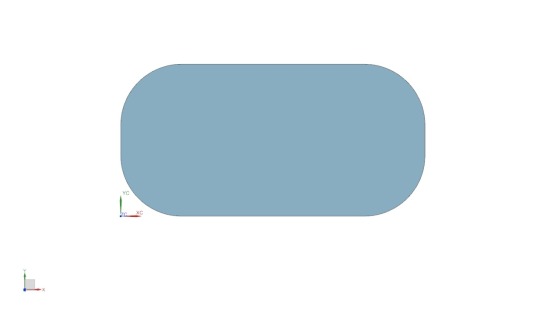
Figure 2. Arbitrary geometry
A simple way of defining such a load distribution on an arbitrary face is with the face’s ISO lines. In Siemens NX, it is only required to define the extreme ISO lines, i.e. U=0, U=1, V=0, and V=1, and NX will automatically create the intermediate lines. Figure 2 shows the extreme values for the ISO lines on the face. Note that U and V definitions are interchangeable.
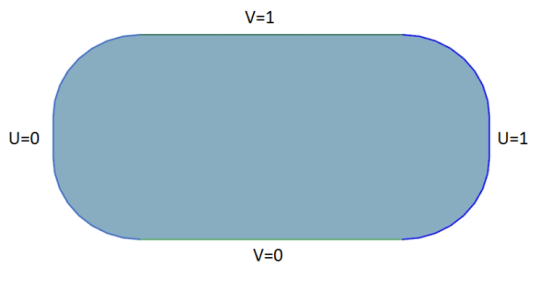
Figure 3: ISO lines for the arbitrary face
The next step is to define a function in terms of U and V that satisfies the requirement of maximum value at the center, i.e. U=0.5, V=0.5, and zero values at the edges, i.e. U=0, U=1, V=0, and V=1. There are many functions that can define such a distribution, a simple one would be:
P(U,V)=P0*sin(180*U)*sin(180*V)
Where P0 is the magnitude of the pressure at the center, which is assumed to be 1 in this example.
Steps
In the sim navigator, define a new load as nodal pressure. Under the Model Object group, select the face on which the load is to be applied, and then in the Magnitude group choose New field->Formula.
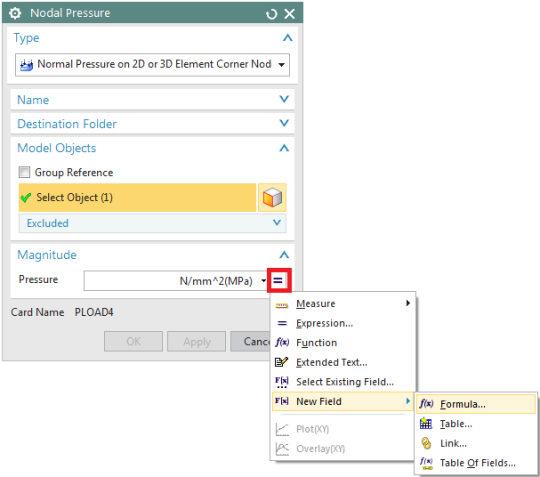
Figure 4. Defining a Formula Field
In the Formula Field dialog, under the Domain group, select the independent variable to be Parameter Plane. Then in the Spatial Map group set the type as Parametric Plane and set the Mapping as ISO Lines. You may need to expand Spatial Map section.
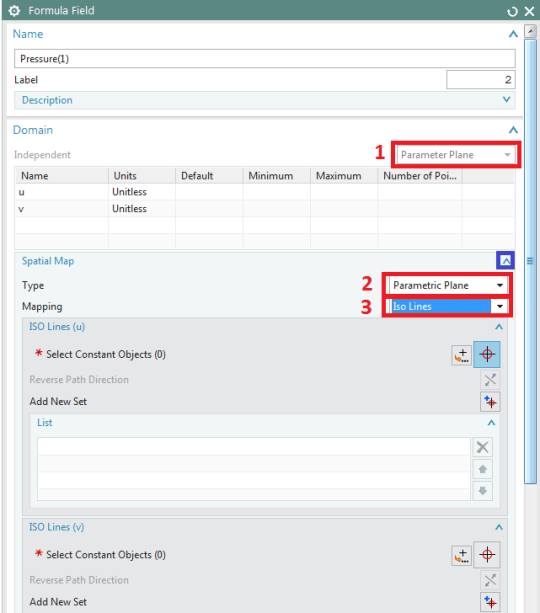
Figure 5. Defining the Isolines
Under the ISO Lines (u) and ISO Lines (v) groups, select the edges that define U and V as shown in Figure 2. Note that after selection of the edge(s) that define either of ISO lines, it is required to click the Add New Set before proceeding to the definition of the next ISO lines.
Then under the Expressions group, enter the function that defines the pressure distribution and click OK.
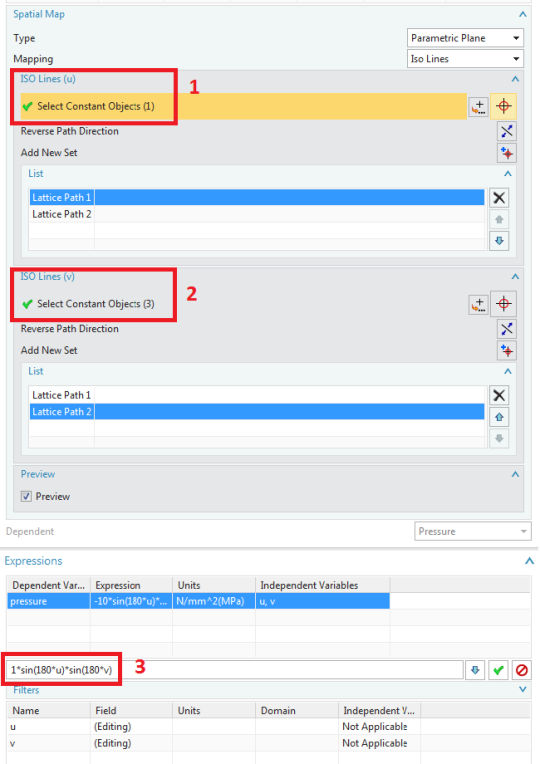
Figure 6. Defining the pressure load expression
To graphically verify the load distribution, in sim navigator, right click on the defined load and select Plot Contours.
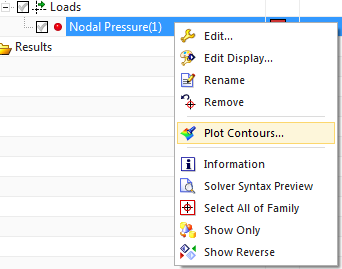
Figure 7. Make a contour plot of the applied load
Then, a contour plot of the applied load will be generated in NX.
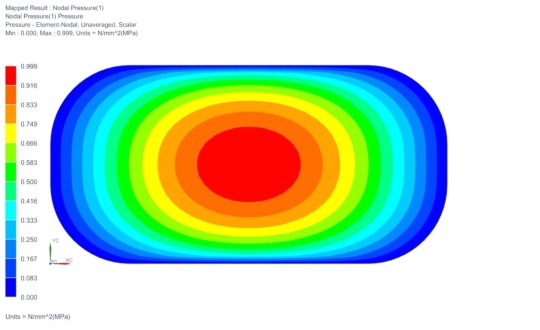
Figure 8. Spatially-varying pressure load
