 Aerospace components are destined to go through repeated stress cycles in extreme environments, gradually accumulating damaging fatigue. In spite of the tough task ahead for these parts, they are sensitive instruments, so fatigue life is naturally top of mind in the engineering stage.
The launch is the most critical moment. A space launch delivers a concentrated burst of stress in the first minutes of the device’s service life. Extreme forces like broad-band vibration, resonant amplification and repeated loading will rapidly fatigue the brackets and electronics, optical assemblies, and other aerospace components.
Some fatigue from launch is inevitable. The question is, “will the component survive launch with acceptable fatigue life remaining?”
Will Your Component Survive Launch Conditions?
Launch loads combine dynamic inputs. Test and structural engineers use sinusoidal and random vibration testing, according to NASA’s Space System Research Integration Knowledge Base, to help determine whether spacecraft and component assemblies will survive the launch vibration environment. The response data helps with validation and refinement of structural analysis models, too.
A fatigue analysis needs to consider a slate of inputs about expected excitation and structural responses. Starting with a modal analysis, engineers can identify natural frequencies and mode shapes, and then they can use sine vibration analysis to evaluate response to swept or discrete-frequency excitation. Random vibration analysis is also essential for evaluating response to a power spectral density, or PSD (representative of broadband launch loading).
From those responses, engineers are able to estimate stress cycles at critical locations and compare them with fatigue properties for the material.
Ultimately, the results will help answer the question about fatigue life and launch conditions. Will the component survive?
How Much Fatigue Life Is Left in Your Component?
One common example of a fatigue life calculation uses Miner’s “cumulative damage” rule:
D = Σ(ni / Ni)
Here, ni is the number of cycles applied at a given stress level and Ni is the number of cycles the material is expected to withstand at that level. A damage value of 1 represents the conventional cumulative-damage failure threshold.
All of this is handled in analytical software (it’s not back-of-the-napkin math), but for a simplified example, suppose one launch produces 10,000 cycles at a stress level with an S-N life of 1,000,000 cycles and another 20,000 cycles at a level with an S-N life of 500,000 cycles.
D = 10,000 / 1,000,000 + 20,000 / 500,000 = 0.05
In that example, the spectrum consumes about 5% of the predicted fatigue life under the assumptions of the calculation.
So, nineteen twentieths of the fatigue life of the equipment will likely remain after launch. Not too shabby. This is, of course, just an illustrative example, not a qualification result.
Real production fatigue life predictions, though, require extensive material data, stress extraction, load spectra, safety factors and correlation with test requirements. The calculations can be both time consuming (even with high end software) and costly. Time is money and the analysis bottleneck prevents engineers from moving the project forward until it’s ready.
Which Analyses Support Fatigue Life Prediction?
Space hardware encounters several dynamic environments, so there’s no one answer here. ESA describes sine, random and shock vibration testing as characteristic modes used to qualify hardware against launch conditions.
- Modal analysis reveals likely resonances.
- Random and sine response analysis determine how launch input amplifies through the structure.
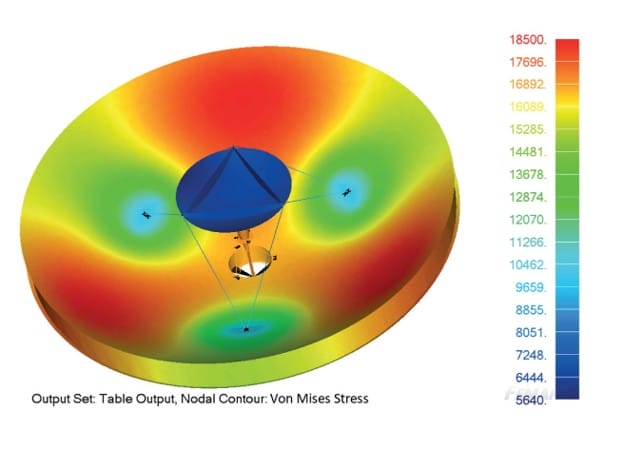
- Stress recovery identifies locations where dynamic response produces damaging stress.
- Fatigue failure analysis then converts those stress histories or statistical response estimates into accumulated damage and predicted component life.
The quality of the fatigue life prediction will really come down to how accurately those steps represent the hardware, mounting conditions and launch environment. This is a stress test of your analytical software as much as the components themselves.
Run Vibration Analysis While Design Changes Are Still Practical
The problem with vibration analysis is that it’s easy to defer when each iteration takes hours or days. Every time a bracket thickness, fastener pattern, support location or material change amplifies stress at a critical location, it exacerbates the delays in analysis.
The Structural Analysis Toolkit (SATK) from Maya HTT is now available to remove that post-processing bottleneck. The SATK reads your Nastran normal-mode results and performs base-driven random and sine vibration analysis, with random vibration calculations up to 200× faster than comparable workflows.
With built-in fatigue analysis, the SATK supports random vibration, sine dwell and sine sweep using stress-life methods including Dirlik, Narrowband and Steinberg.
The faster processing speed — again, up to 200x faster — allows engineers to compare additional design iterations at a time in the design process where changes are still practical.
While time-consuming vibration analysis has historically often been relegated to a late verification exercise, engineers can now use SATK to make fatigue analysis a part of the early design loop.
Talk With Maya HTT About Your Vibration & Fatigue Analysis
Make fatigue life a part of your iteration loop with SATK. If your team needs to assess whether a sensitive aerospace component will survive launch conditions, Maya HTT can help you build a
faster path from Nastran results to vibration and fatigue insight.
Contact our team to discuss your current workflow and fatigue life requirements. In a short demo, we can show you how SATK can help you evaluate additional configurations faster and support better-informed engineering decisions.
Interested in more information? Read the SATK brochure.
Frequently asked questions
How is fatigue life calculated for an aerospace component?
Engineers combine expected cyclic stresses with material fatigue data such as an S-N curve. Cumulative damage methods such as Miner’s Rule then estimate how much component life each stress level consumes.
Does random vibration contribute to fatigue failure?
Yes. Random vibration creates repeated stress cycles across a range of frequencies. Resonant response at particular modes can increase local stresses and accumulated fatigue damage.
How is fatigue analysis different from static stress analysis?
Static analysis evaluates response to a steady load condition. Fatigue analysis evaluates damage accumulated through repeated cyclic loading over time.
Which inputs are needed for fatigue life prediction?
Typical inputs include structural response data, material fatigue properties, expected load spectra, stress results and assumptions about cycle counts or exposure duration.
How does modal analysis support fatigue analysis?
Modal analysis identifies natural frequencies and mode shapes. Those results reveal frequencies where launch excitation produces amplified structural response and higher fatigue risk.
How does SATK support fatigue life prediction?
SATK supports built-in fatigue analysis for random vibration, sine dwell and sine sweep. Available stress-life methods include Dirlik, Narrowband and Steinberg.
Why run vibration simulation ahead of qualification testing?
Simulation helps engineers identify problematic modes and stress concentrations while design revisions remain practical. Test data then supports model validation and refinement.
How much fatigue life does one launch consume?
The answer depends on the launch spectrum, component response and material fatigue properties. Cumulative damage calculations estimate the portion of predicted life consumed by the expected loading.