This is part one of our series. You can find part two here.
Every year, the entirely student-run McGill Formula Electric (MFE) team designs, manufactures, and races a formula-style electric vehicle. Inter-university competitions take place at more than 12 venues around the world. Each of these competitions holds static and dynamic events where both the design and performance of the vehicles are translated into points. Static events are judged by a mix of motorsport and industry engineers, and dynamic events are all about how good the cars really are.
The endurance race is key to winning the overall competition. It offers 275 points of the 1,000 total possible points for the whole competition. The vehicles must complete a set number of laps of a pre-determined circuit in the least amount of time. The endurance race is the true test of the car’s reliability — an effective cooling system is key to that reliability. To achieve optimal performance, the electric and electronic components must be maintained within the specified range of operating temperatures. This year’s design uses liquid cooling for the in-hub electric motors, their respective inverters, along with air cooling for the battery pack.


Figure 1: CAD renders of the MFE car, its cooling loop, and its battery pack
The world is moving quickly towards electric transportation. The MFE team faces the same problems companies across the entire transportation industry will have to solve if they are to rise to the electric challenge.
In this blog series, we demonstrate how to use advanced simulation software (Simcenter Amesim and Star CCM+) to validate and iterate upon an EV cooling system design.
This first post explores how Simcenter Amesim can be used to quickly evaluate the cooling system of the car and obtain insight into battery pack sizing.
Objective: Validate cooling system heat rejection and temperatures with Amesim
This Simcenter Amesim simulation was created to:
- Validate that the cooling requirements of the system were met by the current design.
- Establish transient heat rejection and generation of the car in a race situation.
The cooling requirements set by the manufacturers for motors, inverters and battery cells are listed in the table below.
Table 1: Cooling requirements
| Inverter Cold Plate | Electric Motor | Battery Cells |
| Cold plate surface temperature < 40⁰C | Δ T cooling jacket < 5⁰C | Charging Temperature < 45⁰C |
| Coolant flow rate ≈ 10 L/min | Coolant flow rate > 2 L/min | Discharging Temperature < 60⁰C |
| Coolant inlet < 30⁰C | Coolant inlet < 40⁰C |
The simulation was developed with simplicity in mind, with the goal of building on it down the line.
This first model relies entirely on converting geometrical parameters into macro data. It was built through a collaboration of the vehicle dynamics team, the accumulator team and a member of the cooling and aerodynamics team (who is also a Maya HTT intern).
Model Overview: Lap simulation, liquid cooling loop, battery pack model
The model can be split into three parts:
- Lap simulation data processing
- Liquid cooling loop
- Battery model
As the car has two nearly identical independent cooling loops, only one of them is modelled here.
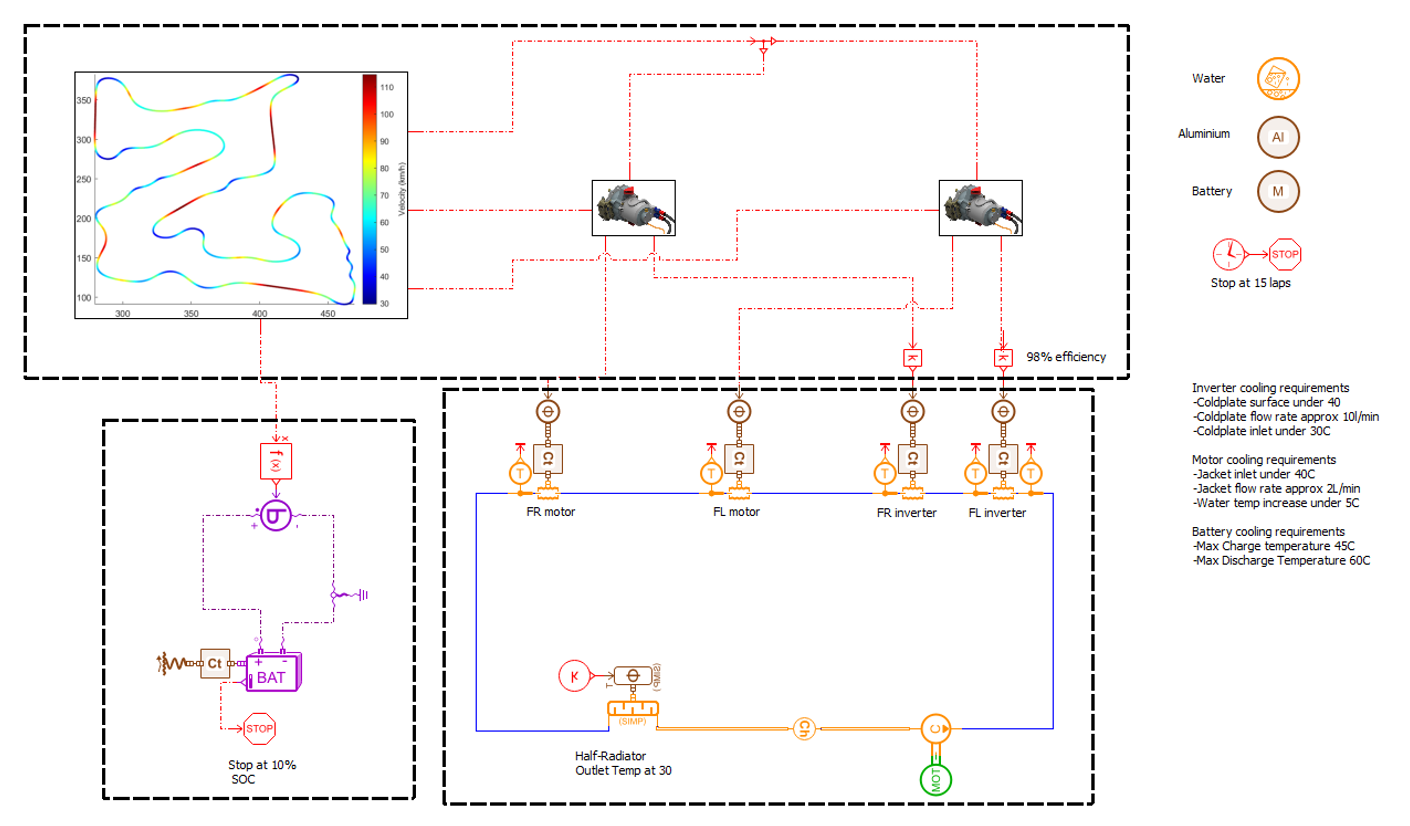
Figure 2: Simcenter Amesim model with its three sub-parts
Lap simulation data processing
The topmost block sets the operating conditions of the system. It processes lap simulation data obtained for a typical endurance racing circuit, and processes it using the efficiency maps to output the heat losses for the inverters and motors. It also outputs the power draw from the battery pack required to achieve the desired power at the motors. It is built in such a way that the lap simulation data can be swapped within seconds to run a different test case quickly.
Battery model
The bottom left component models the discharging of the battery over the duration of the race. It uses a power source to convert the power draw into current and voltage along with a thermal mass with an imposed convective heat exchange coefficient to obtain the average temperature of the pack.

Figure 3: Battery pack model
The battery pack model was set up using the Battery Data Sheet import tool and the pack architecture. The Battery Data Sheet import tool is a built-in feature of Simcenter Amesim that allows the user to import battery cell data from a pdf or image.


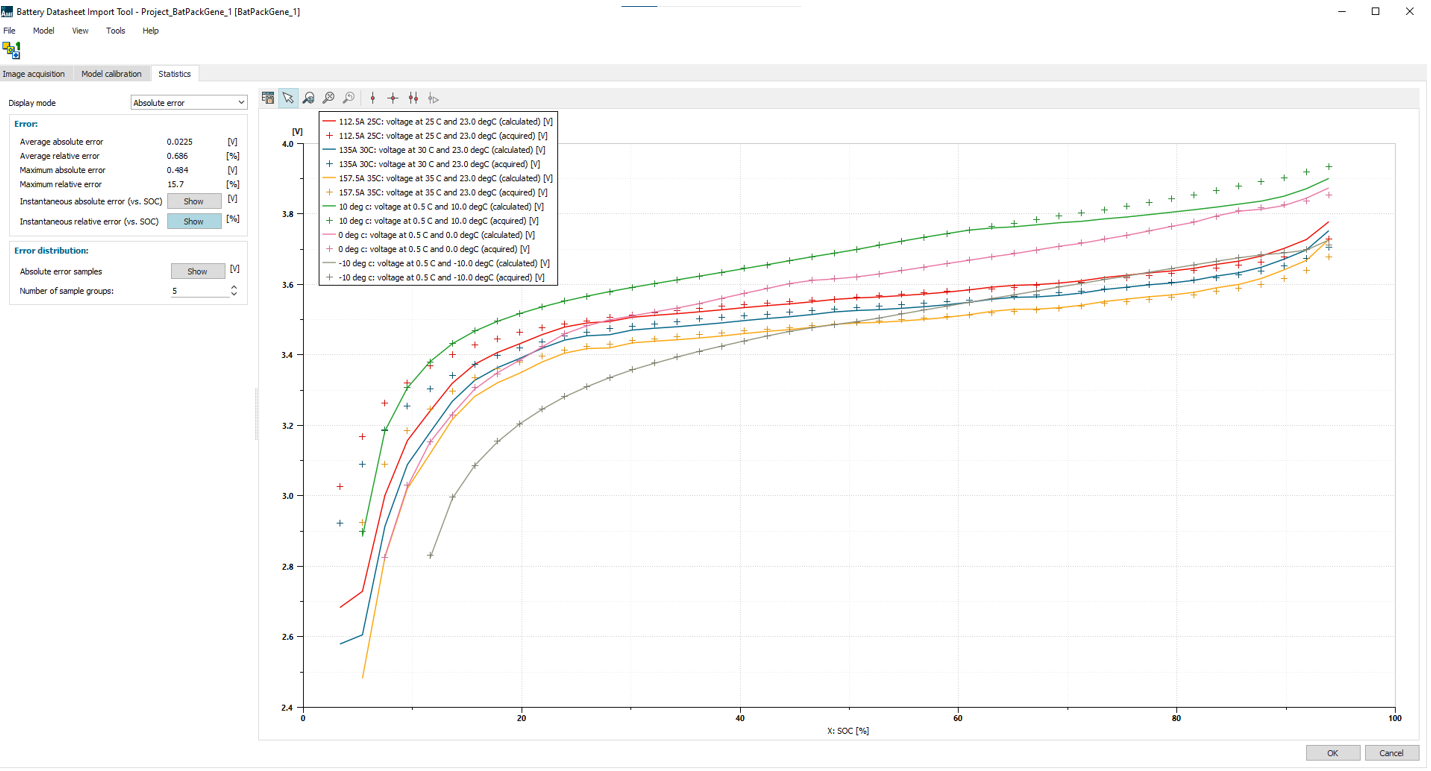
Figure 4: Battery Tool Import and its three tabs: Image acquisition, Model calibration, Statistics
The battery pack on the race car consists of two parralel sets of 144 6 ah cells in series, clocking in at around 600 volts. This part of the model allows both to obtain a good heat rejection and generation estimate, and also serves as a good validation to the sizing of the battery pack and the power draw limits imposed.
Liquid cooling loop
Onto the main part of the simulation, the liquid cooling loops consists of a cold plate cooling two inverters, two motor cooling jackets, a radiator, a catch can, and a pump.

Figure 5: Liquid cooling loop
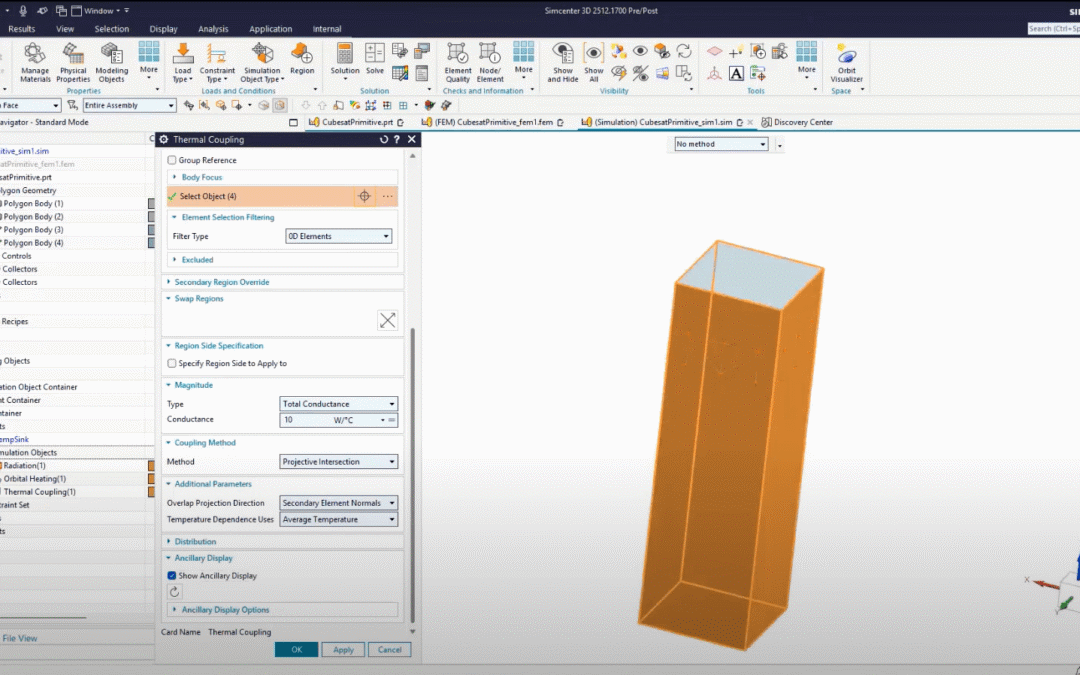
It is assumed that all the heat is rejected directly into the thermal mass of the different devices and components and subsequently absorbed by the coolant. This is modelled by the four blocks at the top consisting of a heat flow converter (from lap simulation data), a thermal mass block, and a heated pipe (left most block highlighted). The thermal mass block makes it possible to transiently model the heat transfer during the race and to monitor the average temperature of the components. The heated pipe blocks convert the geometric data of the cooling device into heat flow.

Pressure drop is also calculated from the geometric data. The mass flow rate is calculated by the software based on the total pressure drop and the given pump performance curve.
Lastly, the radiator model is a simple half heat exchanger with piloted heat flow to maintain its outlet temperature at 30⁰C. This was done to meet the cold plate inlet temperature requirement and to keep the model simple. Accurately modeling heat exchangers is more involved and one of the many ways to do it in Amesim is to use two half heat exchangers with a NTU-effectiveness based heat flow calculator.

Figure 6 & 7: Radiator geometry and its Simcenter Amesim equivalent
Results: Valid design that could use some improvements
The simulation was left to run for 15 laps of the simulated track or until the battery state of charge (SOC) reached 10%.
Simcenter Amesim allows the user to monitor any variable or combination of variables in custom plots. We plotted heat flow rates, coolant temperature, battery pack SOC, and average component temperature to validate the design.
The results presented are from the simulation with the piloted heat exchanger, with the results of the simulation of the actual radiator at the end of this section.
Battery pack
The lap simulation was run at a 40-kW cap on battery pack draw. We found that this made it possible for the car to complete the endurance race. The cooling capabilities were sufficient to maintain the average temperature of the pack under 36⁰C with ohmic resistance losses oscillating between 0 and 400 W, spiking as the battery pack approached 10% SOC.

Figure 8 & 9: Thermal management plot (left) and State of charge plot (right)
The battery state of charge and voltage were also monitored. These showed that the battery pack can sustain the demands of endurance.
Liquid cooling loop
The first requirement to check for the cooling loop is that the target mass flow rate of 10L/min is hit by the pump. This is quickly validated. Coolant temperature is the next item that needs to be verified.

Figure 10: Coolant Temperature at different points in the cooling loop
The temperature increase across the cooling devices is within the limit fixed by the manufacturer and in line with hand calculations. A similar plot was made to monitor the average temperatures of the inverter cold plate and the motors.

Figure 11: Temperature of cooled components
The maximum cold plate temperature requirement of 40⁰C cannot be validated with the current discretization of the domain, but with an average temperature slightly above 31⁰C, the system is operating in the correct range.
Lastly, it is interesting to quantify the average heat absorption for each cooling device from initial state to steady state. Subsequently, monitoring the heat rejection the radiator must achieve to maintain the outlet temperature at 30⁰C can give a good insight into the sizing of the radiator and what kind of performance it needs to achieve.

Figure 12: Heat flow through the components of the liquid cooling loop
With the cold plate dissipating around 200 W and the motor cooling jackets around 800 W each at steady state, the radiator must reject roughly 1800 W of heat from the coolant at steady state. The radiator/fan selection can then be achieved by taking this target heat rejection and the delta between inlet coolant temperature and ambient temperature.
Quick research showed that the radiator might not be up to par, and that the 30⁰C cold plate inlet requirement might be impossible to achieve, especially in hot conditions. This was also tested with the full heat exchanger block presented in figure 7.
The results indicate that the current radiators need a steep thermal gradient between the air and the coolant before reaching steady state. The temperatures therefore stabilize at higher values.

Figure 13: Heat transfer and coolant temperature at the inlet and outlet of the radiator
While this is not ideal, catching this is exactly the goal of this simulation. Possible solutions, such as increasing coolant and air mass flow rate, changing radiator or splitting the inverters and motors on two cooling loops can now easily be investigated with the model.
Next steps
The purpose of this model was to validate that the current system was operating in the right ballpark. While accuracy is a concern, it can and will be improved.
The next post on our series will focus on using CFD simulation in Star-CCM+ to loosely couple CFD data to the Simcenter Amesim model and improve the model’s accuracy.
Conclusion and take-aways
The simulation allows for a full initial characterization of the cooling system of the MFE car. It also serves as a mean to validate battery pack sizing and cell choice in the context of the endurance race. The next post on our series will focus on using CFD simulation”
Simcenter Amesim made setting this up effortless – a huge improvement from the commonly used spreadsheets and less-intuitive Simulink models. The simulation is now easy to iterate upon to further develop the design.
Contact a Maya HTT expert today to benefit from world-leading expertise in developing simulations such as these.
Frédéric Vallée, Engineering Intern, BSc Mechanical Engineering McGill University