Quick Overview
Sandwich panels are prevalent in many structural applications. The panel facesheets react the membrane and bending loads, whereas the core reacts the bulk of the transverse shear loads. For honeycomb cores, transverse shear failure can be critical. Traditional first-ply failure criteria such as Tsai-Wu and maximum strain are not applicable to core plies.
This tips and tricks shows how to use NX Laminate Composites to identify a core ply and to automatically compute 13 and 23 core shear failure index, margin of safety, and strength ratio results.
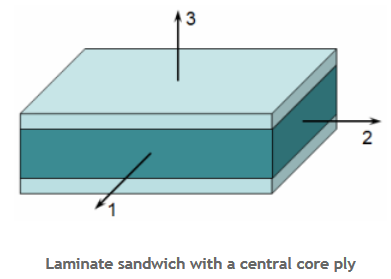
Figure 1: Laminate sandwich with a central core ply
NX Laminate Composites allows you to define dedicated objects called ply materials, which use the properties of NX materials in different ways: Core ply materials automatically use the 13 and 23 shear stress limits, defined in orthotropic material tables, as the basis for failure metrics output by NX Laminates Post Reporting. The core shear failure indices are computed as:
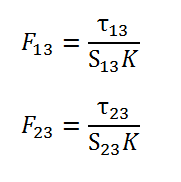
where K is a core strength correction factor.
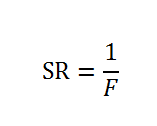
The strength Ratio, SR, is defined as:
Margins of safety, MOS, are then computed as follows:
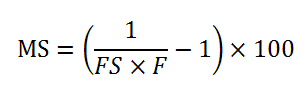
where FS is a user-specified factor of safety.
Core content
Suppose that you wish to evaluate shear failure in the variable thickness core of the lower horizontal panel of the composite T-Joint shown in Figure 2. The core is modeled as 3D elements, which were automatically created using NX Laminate Composites’ 3D inflation capability.
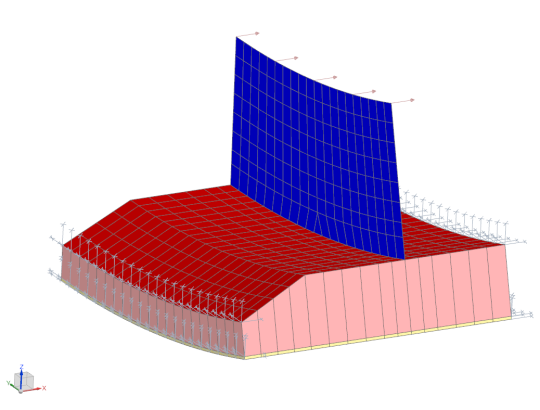
Figure 2: Composite T-Joint with a variable core thickness
Steps
To define the core ply material, go to the Laminates tab and click Ply Materials.
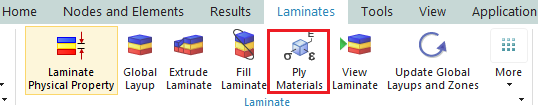
Figure 3: Laminates tab
In the Laminate Ply Material Manager dialog, first select Core as the Type and then enter a descriptive name for the ply material and finally click on Create.
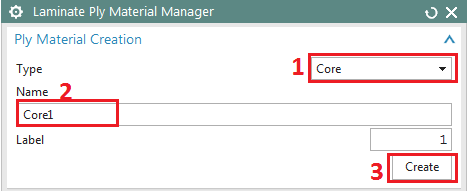
Figure 4: Create core ply material
Then in the Laminate Ply Material dialog and under the Basic Information group, the material for the core can be selected from the drop-down menu, which includes already defined NX materials. Click on the Choose material to select a material from the NX library or to create a new material.

Under the Options group, select Expression for the strength correction factor, and enter an expression in the Expression box (Figure 5): When the core ply is modelled using 3D elements, the solver scales the ply thickness as a function of the through-thickness distance between the nodes, and the correction factor should not be defined using a field.
Click OK to close the dialog.
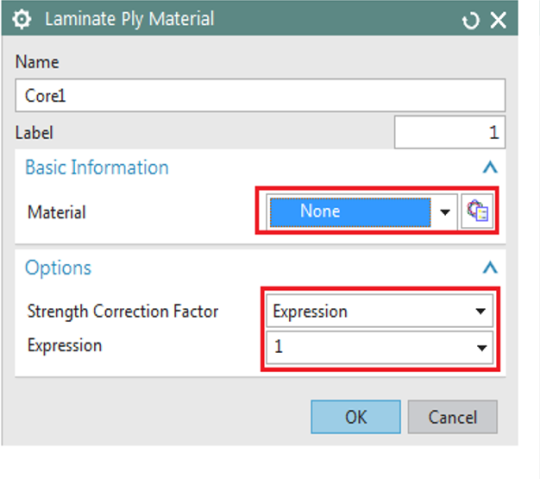
Figure 5: Define the core properties
In the layup modeler, select or create the core ply, check the Ply Material box and then from the drop-down menu select the core ply material just created.
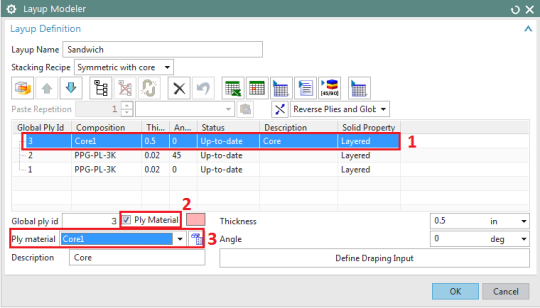
Figure 6: Assign the core material to a ply
To calculate the failure indices, strength ratios and margins of safety, go to your sim, solve the model and when the solution is complete go to Post Processing Navigator. In the Laminates tab, select Advanced Post Report, from which you can create either a Graphical Report, or a Spreadsheet Report, or both.
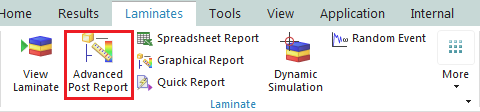
Figure 7: Advanced Post Report
When creating an advanced post report, make sure to request the desired failure metrics such as failure index (FI), strength Ratio (SR) and margin of Safety (MOS). The Factor of Safety value, which is required for the calculation of the MOS, can be entered under the Strength Analysis group (the default value is 1.0).
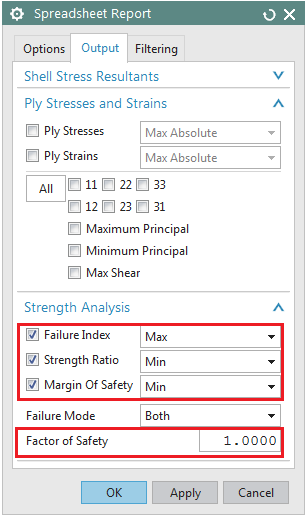
Figure 8: Request failure metrics to be calculated
NX Laminate Composites then automatically calculates the shear core failure FI, SR, and MOS for the core ply, while using the failure theory defined in the laminate physical property to compute metrics for the other plies. Spreadsheet report creates an excel file, which lists the failure metric values for the core (Figure 9). The Graphical Report can be used to generate contour plots of FI, SR, and MOS for the core, as well as all the other plies (Figure 10).
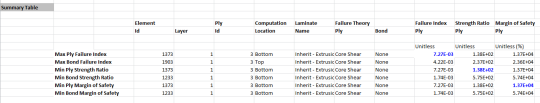
Figure 9: Spreadsheet Report listing core shear FI, SR, and MOS
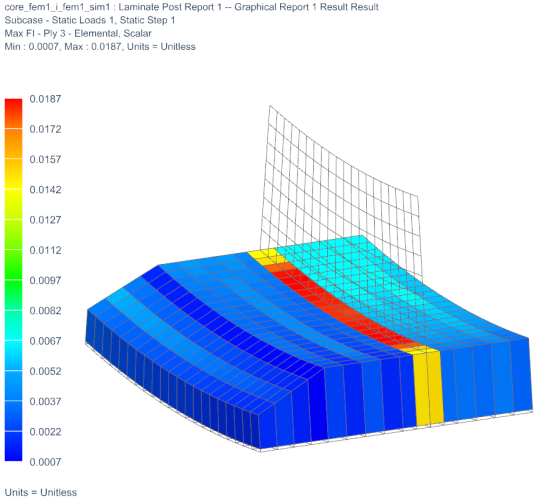
Figure 10: Graphical post report showing core shear failure index