Author: Zouya Zarei
Zouya is a Thermal Flow Application Engineer at MAYA Heat Transfer Technologies based in Montreal, Quebec, Canada. He has long fostered a fascination with fluid dynamics, which ultimately led to higher studies in computational fluid dynamics. He now spends the majority of his time analyzing the real-world applications of thermos-fluid principles. When not teasing apart the latest conundrum, he can usually be found either practicing figure and portrait drawing, or improving his Japanese language skills.
Flow-induced vibrations
The bone-chilling winter winds in Montreal can elicit many a heartfelt curse into our tightly wrapped scarves. As we are buffeted every which way on particularly blustery days, it is easy to forget the ingenuity and sound decisions that ensure our buildings and structures can easily withstand adverse weather conditions. In the early 20th century, the role of aerodynamics on structural response was not well understood. The quest to build ever-lighter suspension bridges culminated in the spectacular collapse of the Tacoma Narrows Bridge on November 7th, 1940.
Full Story: http://motherboard.vice.com/read/the-myth-of-galloping-gertie
Engineers were initially caught off-guard by the catastrophic failure of the bridge but the event spurred a great deal of research into the influence of wind on structures. The Tacoma Narrows Bridge collapsed due to aero-elastic flutter: oscillatory motion induced by the air flowing around it. The twisting of the bridge deck grew in amplitude until the suspension cables snapped and the entire mid-span collapsed.
It is therefore crucial to fully understand how structures respond under windy conditions. Fortunately, we can leverage the powerful capabilities of NX Flow to gain this insight.
Vortex shedding
Fluid flow can be broadly categorized into three regimes: laminar, transitional, and turbulent. In laminar flow, the fluid remains stratified and no mixing occurs beyond molecular diffusion. Turbulent flow is characterized by vortices at multiple scales and intense mixing. Between these two extremes is the transition between laminar and turbulent flow.
The flow characteristics arise out of the interplay between the inertial and viscous forces in the fluid, characterized elegantly by the Reynolds number:

where ρ, u, μ are the fluid density, velocity, and dynamic viscosity, respectively, and L is the characteristic length.
Figure 1 – Flow over a cylinder at different Reynolds numbers [1].
Consider a cylinder in cross-flow (Figure 1). At low Reynolds numbers, the flow is laminar and remains attached to the cylinder. As the Reynolds number is increased (e.g. as the velocity is increased), the flow separates on the downstream side of the cylinder. Two vortices are created that remain attached. Beyond Re = 40, an interesting phenomenon occurs. Each of the two vortices that formed behind the cylinder is alternately swept downstream in what is known as a Von Karman vortex street. The variation of the pressure distribution over the surface of the cylinder manifests as an oscillatory drag force, which is the source of flow-induced vibrations in structures. The flow velocity need not be high, just that the Reynolds number is in the right range. This is why the Tacoma Narrows Bridge underwent large (eventually unsustainable) oscillations even though the wind speeds were not particularly high.
Vortex shedding can be simulated and visualized beautifully using NX Flow. We started with a model of a cylinder in cross-flow in the NX environment. The fluid domain was discretized using the structured mesh shown in Figures 2 and 3. The inlet and outlet were defined on the left and right of the domain, respectively. The top and bottom surfaces were designated as no-slip surfaces with the lateral faces specified to be periodic boundaries. The fluid properties and inlet velocities were set to be consistent with a Re = 100 flow. The cylinder surface was set to 20°C higher than the free stream fluid to provide a simple method of visualizing the vortex street.

Figure 2 – The structured mesh around the cylinder.
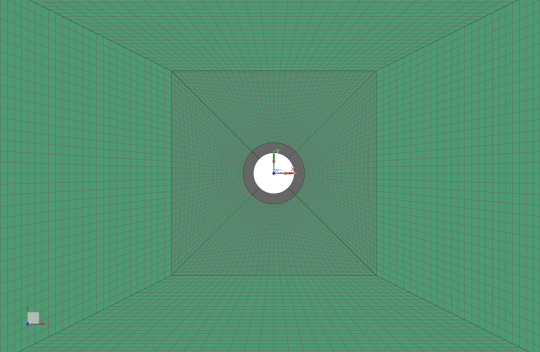
Figure 3 – A magnified view of the structured mesh in the vicinity of the cylinder.
The results of the simulation are presented below. The regular, periodic wake flutter is a direct consequence of the vortex shedding (Figure 4). This is accompanied by a variation in the pressure distribution around the cylinder, which ultimately manifests as an oscillating drag force. We also recover the Von Karman vortex street exactly as it would appear in experiments (compare Figure 5 with the diagram in Figure 1).
Figure 4 – Wake flutter behind the cylinder.
Figure 5 – The vortex street behind the cylinder visualized using the temperature distribution.
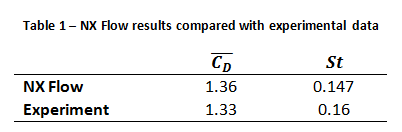
Just as the Reynolds number characterizes the flow regime, oscillatory flows are described by the Strouhal number:

where τ is the period of oscillation. A further measure is the time-averaged drag coefficient:
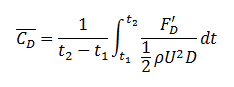
(C_D ) ̅ and St calculated based the results obtained from NX Flow agree well with experimental data (Table 1).
Innovative structural design
How does this simple example tie in to our infrastructure? Accurate analyses of flow-induced vibrations go a long way towards ensuring that our infrastructure is robust to begin with and will stand the test of time. The simulation capabilities of NX Flow help shed light on the interaction between structures and wind forces, which guides engineers’ attention to critical design shortfalls. Used in concert with the Synchronous Technology of NX CAE, design changes can be quickly propagated to the analysis phase. With these powerful tools in hand, potentially harmful oscillations can be mitigated.
Today, the design of large structures is intimately tied to its aerodynamic behavior. Buildings are positioned such that their broadest face is angled away from the direction of the prevailing winds to prevent the buildup of excessive stresses. Architects also use a number of methods to mitigate flow-induced oscillations. Take the Burj Khalifa, for example. It rises about 830 m above Downtown Dubai, United Arab Emirates, and is currently the tallest skyscraper in the world. The asymmetric structure impedes the formation of vortex streets, thus reducing the possibility that a dangerous oscillatory motion would develop.
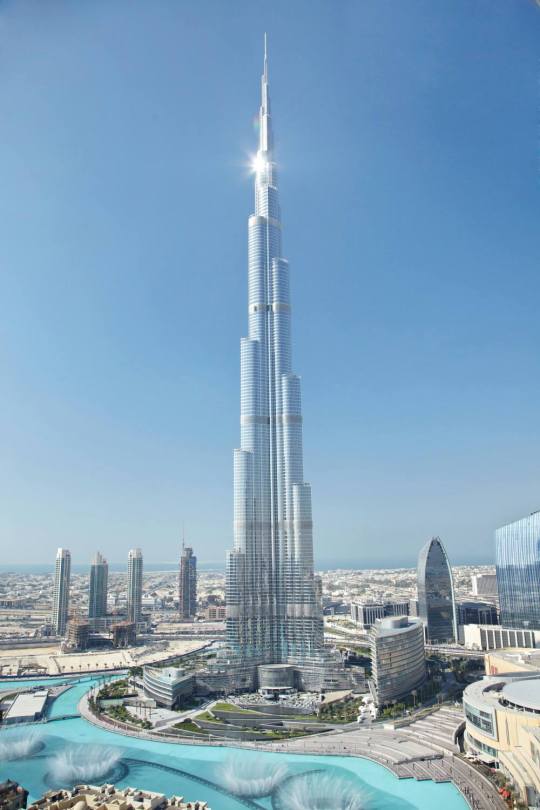
Figure 6 – Burj Khalifa [2].
As our buildings rise ever higher and our computers ever more powerful, it will not be long before we can routinely perform full scale analyses of entire neighborhoods. And for those of us who contend with freezing winters, perhaps that will mean fewer wind corridors and some respite from the icy wind chill.
References
[1] R. D. Blevins, Flow-induced vibration, New York, NY (USA): Van Nostrand Reinhold Co., Inc., 1990.
[2] “Burj Khalifa,” [Online]. Available: www.burjkhalifa.ae. [Accessed January 2016].