Quick Overview
A powerful way of reducing design conservatism is to validate the finite element model used to simulate its performance. Comparing the simulation model’s natural frequencies and mode shapes with those acquired in test generates confidence in the model’s ability to represent the as-built structure. This in turn allows analysts to reduce the safety factors used to compute structural margins of safety. Simcenter 3D FE Model Correlation supports both test and simulation engineers who wish to perform such a comparison, efficiently providing both visual and quantitative feedback.
Background
The Modal Assurance Criterion (MAC) is a parameter indicating the degree of consistency between a mode shape from test and another one from simulation. This parameter is a scalar value between 0 and 1: A MAC value near 1 indicates a high degree of correlation or consistency between two mode shapes.
Suppose {ΨA} and {ΨX} are two mode shapes that you want to compare: Their MAC is expressed as follows:
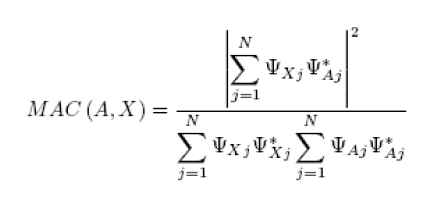
Where:
- N is the number of common simulation and test mode shape components
- The superscript * indicates the complex conjugate value.
There are LA x LX MAC numbers for given mode shape matrices [ΨA] and [ΨX], where LA is the number of mode shapes in [ΨA] and LX is the number of mode shapes in [ΨX]. These are presented in matrix format:
Problem Definition
We wish to compare the natural frequencies and mode shapes of an aircraft engine nacelle finite element model with the equivalent data acquired during a modal test of the actual structure:
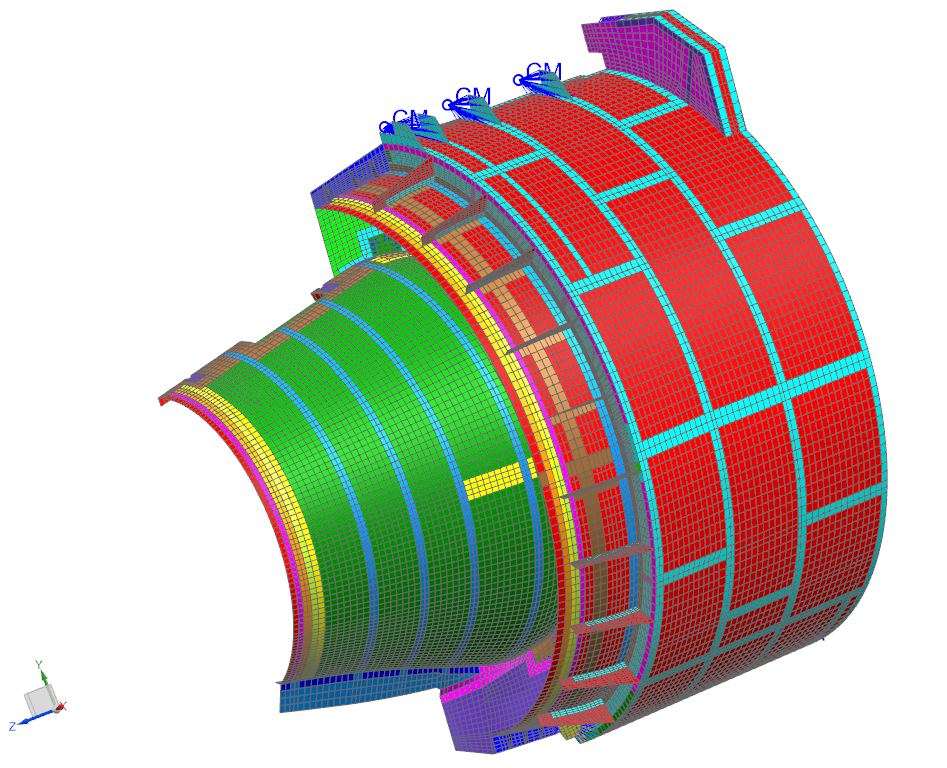
The model and test article both represent half the nacelle.
1. Normal Modes Solution
First we create an NX Nastran normal modes solution, requesting the first 20 free-free (unconstrained) modes of the FEM. The first 6 modes describe rigid body motion, in which the structure moves without any internal strain. The next 14 modes are elastic modes, which are the ones we are interested in correlating.
In the simulation navigator, select the top-most sim node and right-click New Solution
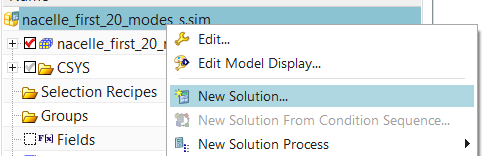
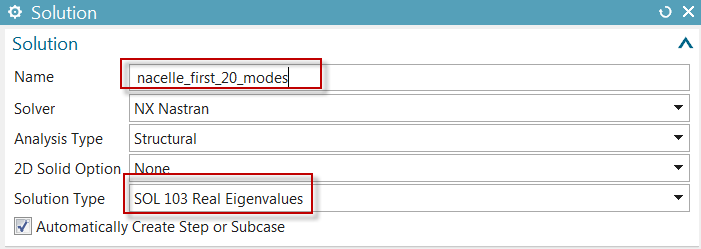
The Solution dialog pops up. Enter a Name and as Solution Type, select Sol 103 Real Eigenvalues from the list
In the Case Control tab of the Solution dialog, next to Lanczos data click Create Modeling Object
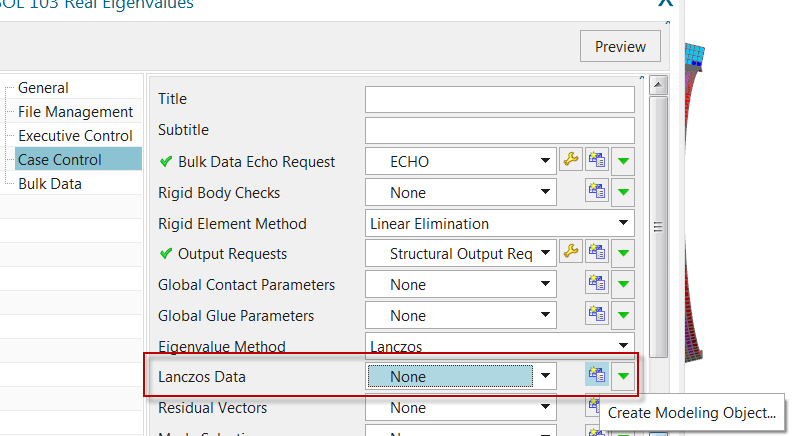
\u2003
In the Real Eigenvalues Lanczos dialog, enter 20 as the Number of Desired Modes. Click OK twice.
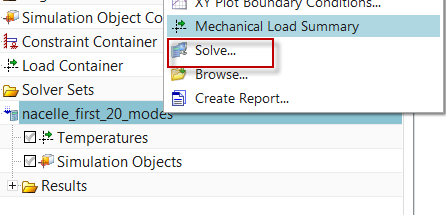
In the sim navigator, select the solution, right-click, Solve
After the solution is complete, the mode shapes can be displayed from the post navigator.
2. Import Test Geometry and Results
In the Correlation tab of the Simcenter 3D ribbon, click New Test Reference Solution
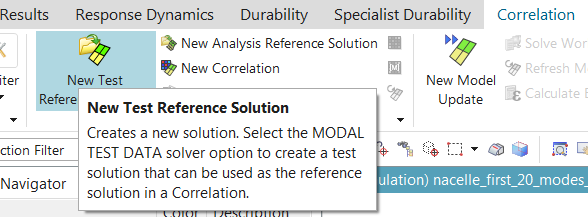
Set the Solution Type to Modal Test Data, and then select a Geometry File which contains the test geometry (test sensors, coordinate systems and traces) as well as a Modes File containing the test mode shapes and natural frequencies. In this case, the same file contains both the geometry and the mode shapes.
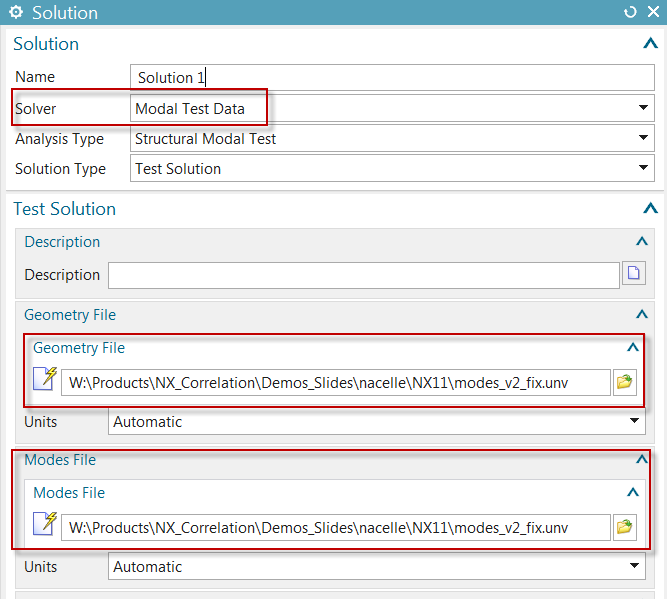
Click OK. There are now 2 solutions in the sim file.
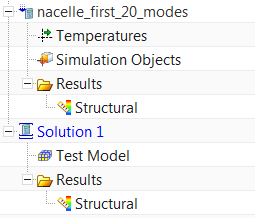
Since Solution 1 is active and points to imported geometry, the fem is now displayed as monotonic grey.
3. Align the Test Model
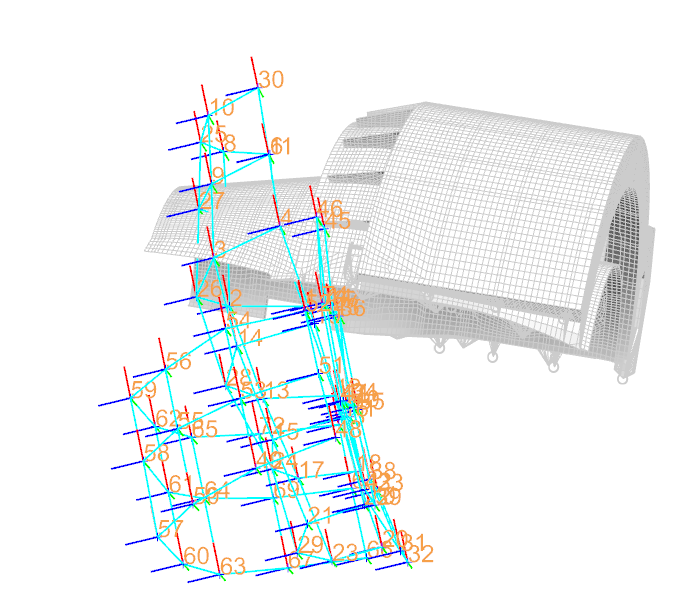
In the sim navigator, under Solution 1, select the Test Model node, and right-click Show Model.
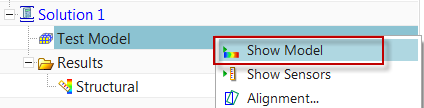
You can also click Show Sensors, to see the individual sensors as triads.
It is clear that the test model and the FEM do not share the same global coordinate system. The test model will have to be aligned with the FEM in order for correlation to be possible.
In the sim navigator, under Solution 1, select the Test Model node, and right-click Alignment. The Alignment Control dialog will appear, allowing you to choose 3 test nodes and the equivalent 3 nodes in the FEM. Checking on Preview allows you to see the cumulative effect of the pairs you have selected.
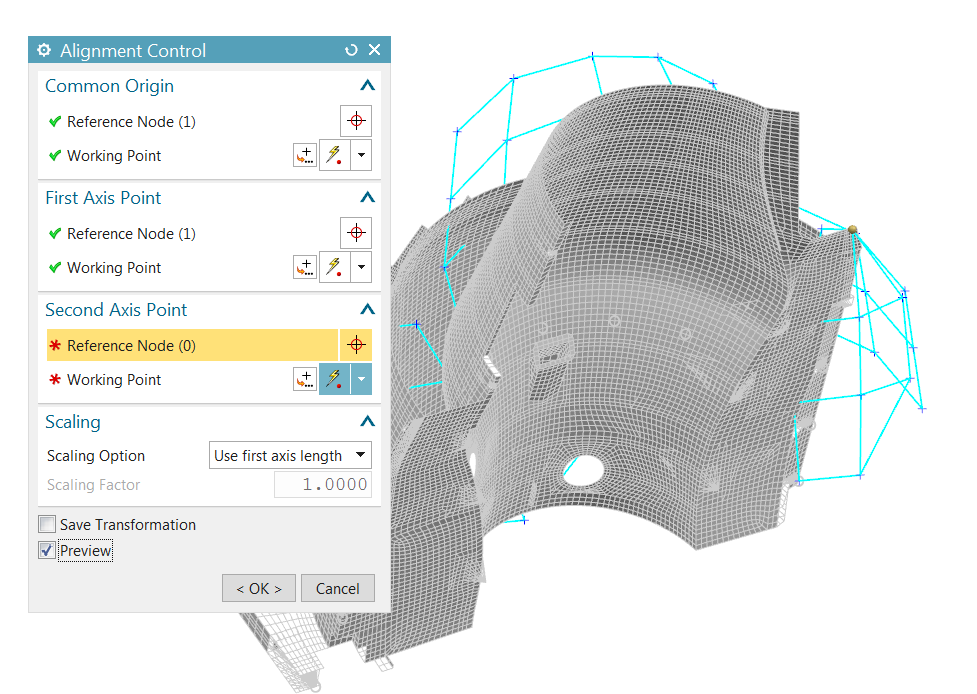
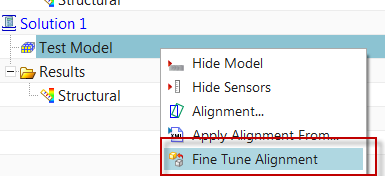
You may need to repeat this step if it is not clear which test sensors correspond to which nodes. After you have successfully performed the alignment, you may select Fine Tune Alignment to further nudge the test model by specifying discrete translations and rotations.
4. Create a Correlation
In the Correlation tab of the Simcenter 3D ribbon, click New Correlation
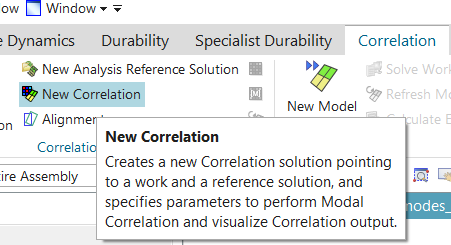
The Correlation dialog appears. Select test Solution 1 as the Reference Solution, and your normal modes solution as the Work Solution
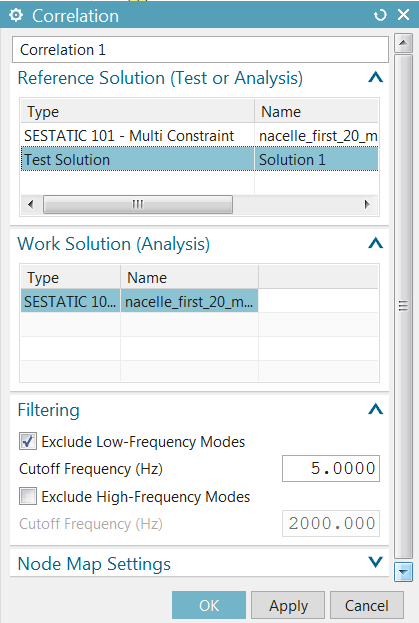
By default, low-frequency (rigid-body) modes are filtered out. In the Node Map Settings group, enter 75 mm as the matching tolerance between the test sensors and the FEM nodes. Click OK.
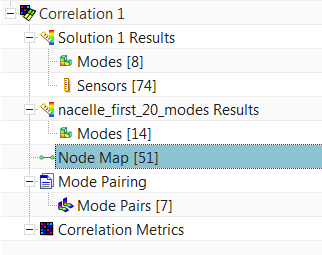
Based on the alignment that was performed, and the tolerance entered in the last step, Simcenter FE Model Correlation was able to map 51 sensors to the FE model nodes, based on proximity. If you repeat the alignment and choose different alignment node pairs, you will see a different number of paired nodes in brackets. The test and analysis mode shapes will be interrogated at these 51 locations to determine the MAC.
Next, select the Mode Pairing node under Correlation 1, right-click Edit. The default mode pairing criterion is MAC with a minimum value of 0.7: This means that test and analysis modes having the greatest MAC value above 0.7 will be paired, others will not be paired. For example, work (analysis) mode 12 is not paired to any test mode.
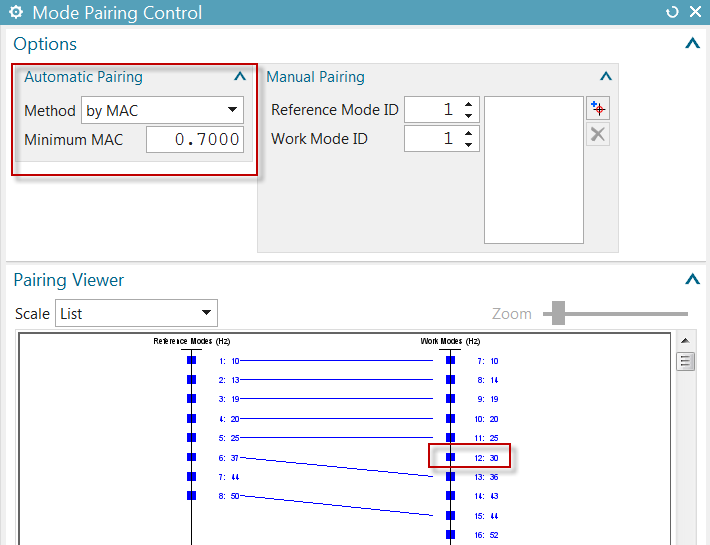
Other pairing methods can be selected.
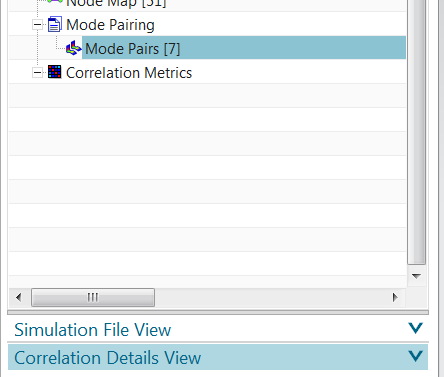
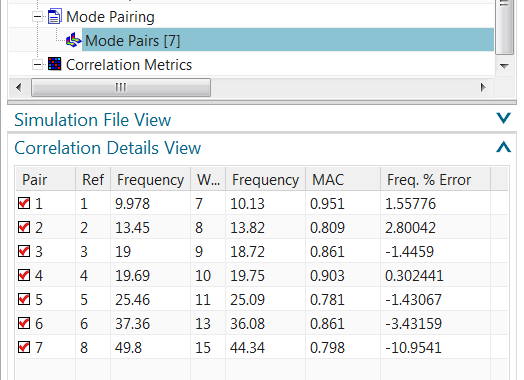
Next, select the Mode Pairs (n) node under the Mode Pairing node and click the Correlation Details View bar
This pops up the Correlation Details View, which shows the test (reference) and analysis (work) frequencies, percent frequency error and MAC, for each mode pair.
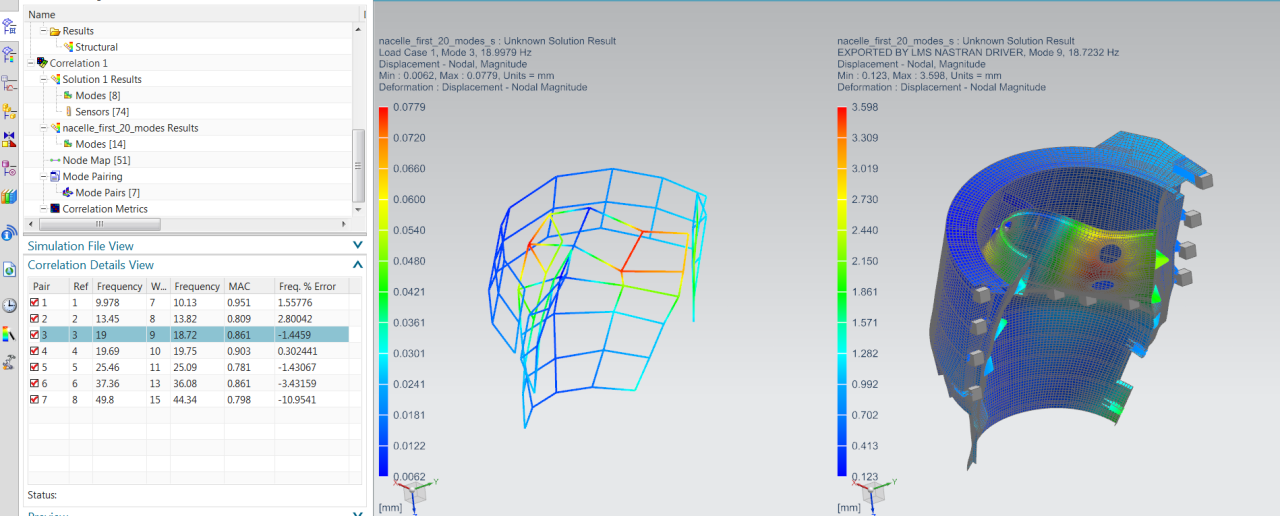
Select any mode pair row in the table, right-click Side-by-Side Animation:
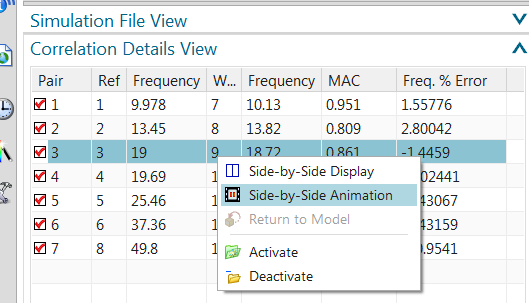
This will bring up a synchronized 2-view layout, showing the test and analysis mode shape animation
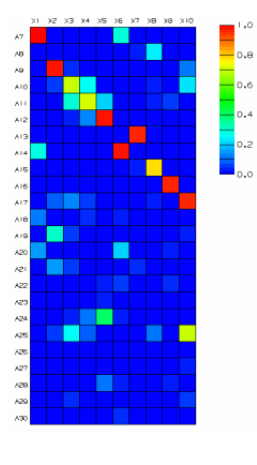
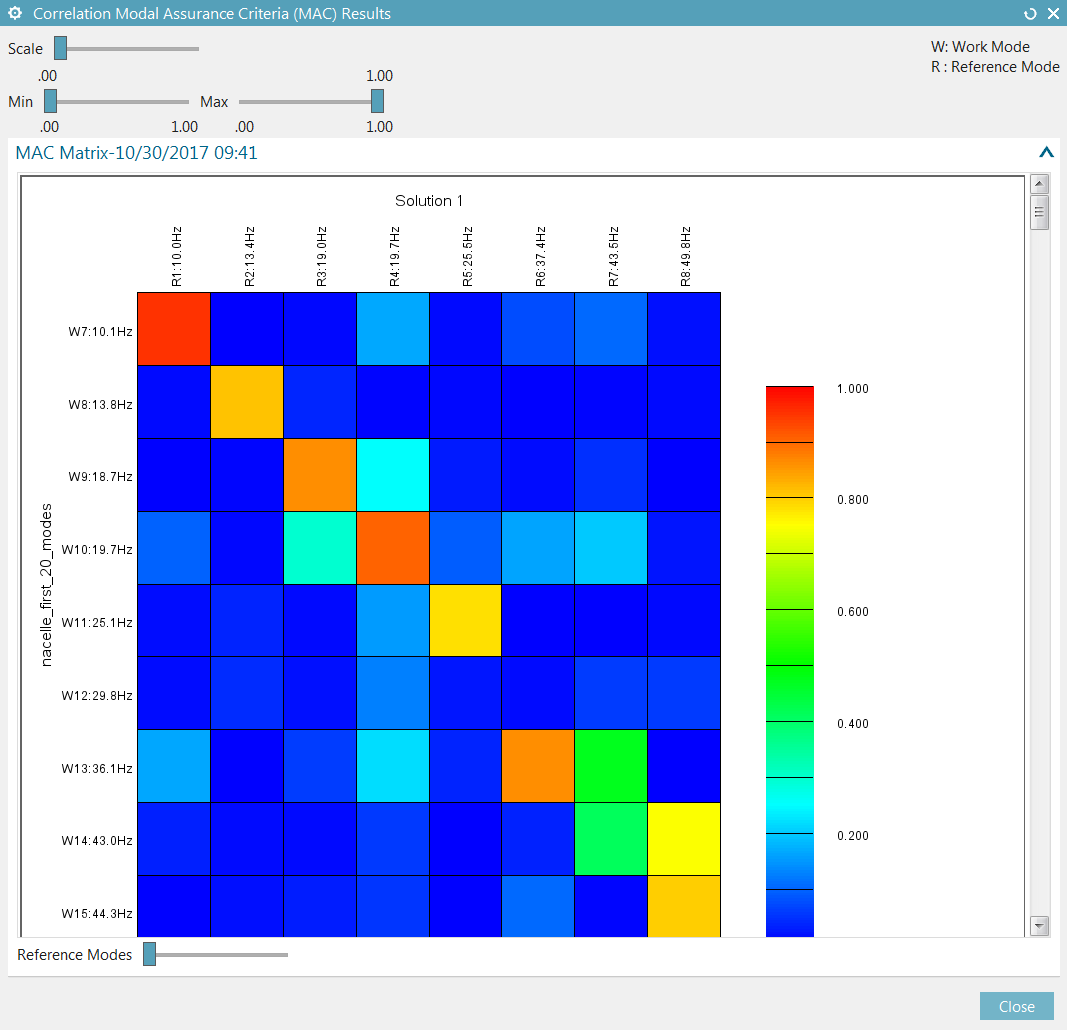
Select the Correlation Metrics node under Correlation 1, right-click Correlate. In the Correlate dialog, click Show Results Heat Map
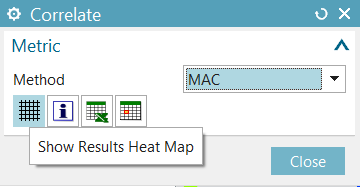
The heat map display shows the MAC matrix
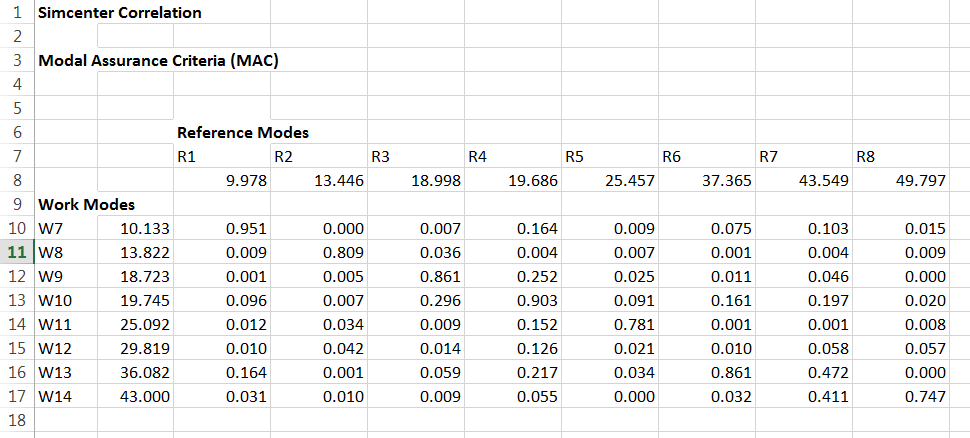
In the Correlate dialog, click Show Results Spreadsheet
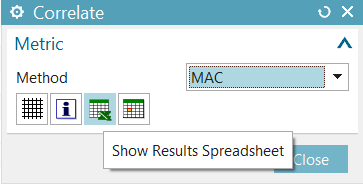
SC FE Model Correlation will send the MAC matrix to an Excel spreadsheet.
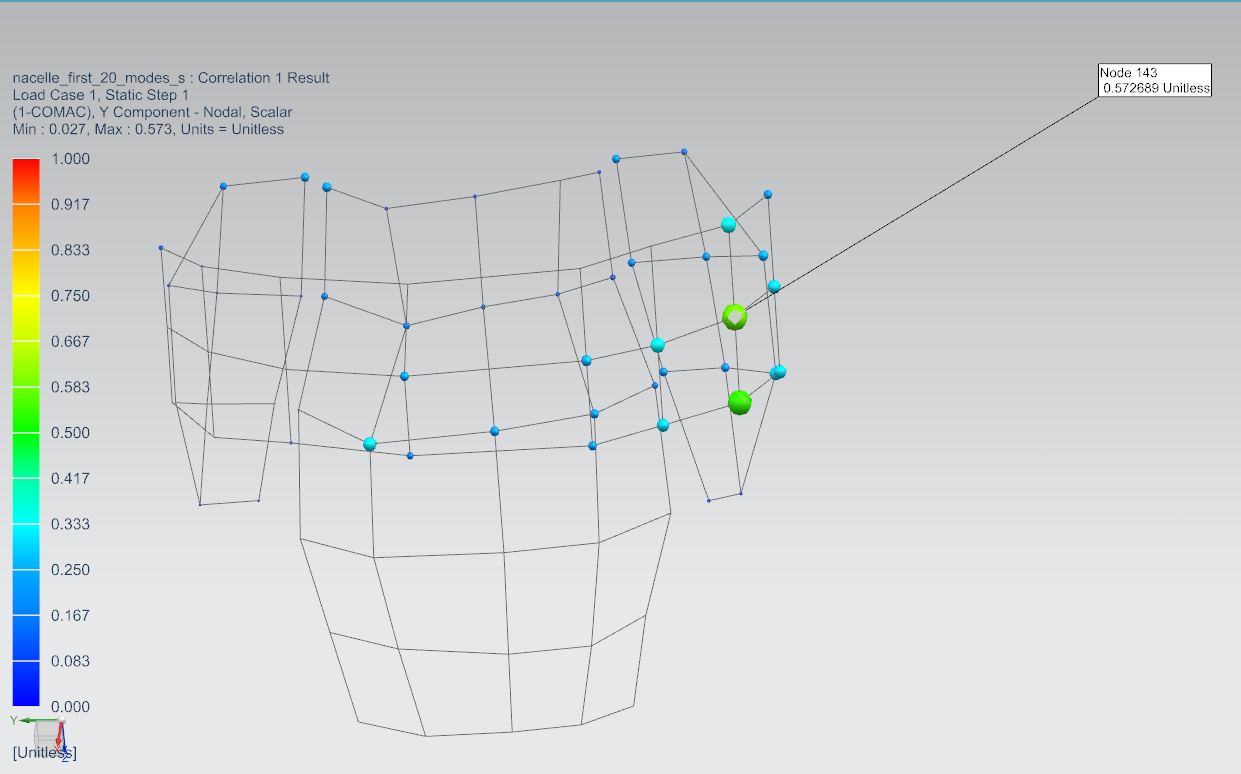
Select the Correlation Metrics node under Correlation 1, right-click Generate 1-COMAC Results.
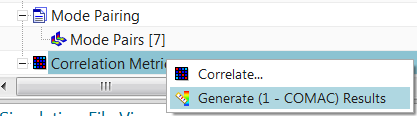
This will show sensors at which the individual MAC components are poorest.